Nothing quite spikes human interest like a good old fashioned mystery, and the the events at a radio telescope in Delaware, Ohio in 1977 could qualify as just that. The voluntary radio astronomer on duty, Dr. Jerry Ehman, noticed a signal that has gone down in history as one of the great puzzlers of the SETI project. This signal was a narrow band radio emission focused around 1420 MHz (or 21cm in wavelength terms) which lasted all of 72 seconds and was the most intense signal that has ever been seen by the Big Ear radio telescope. The signal was so intense and unexpected, that Jerry circled the 6 digit signature of the signal and commented ‘Wow!’. To this day it remains unclear what exactly the signal was, but I hope to be able to cast a little light on it in this post.
A Little About the Big Ear
To have even a minuscule hope of ascertaining the source of the infamous signal, we must first find out a little about the characteristics of the observing equipment which picked it up. The Big Ear radio telescope was a Kraus-type radio telescope based on the grounds of Ohio Wesleyan university. This telescope was part of the SETI project, or Search for Extra Terrestrial Intelligence. This is survey that was running that fateful day when the infamous signal was received. The telescope was made up of two reflectors, one flat and one paraboloidal. The flat reflector would reflect the radio emissions onto the parabolic reflector which would focus the signal to the focal point at the two feed horns, one positive and one negative. These horns would pick up the radio signals and feed them down to the receiving room below. They were mounted on a platform which could move back and forth along a track and could be moved to track sources across the sky. Between all of this was 3.2 acres of aluminium coating the floor, to prevent radio from nearby objects from interfering. For a pretty nifty guided tour and images of the telescope, check out the official site here.
On the night in question, the telescope was looking up at the sky in the direction of the constellation Sagittarius. At the time of signal, the equipment was unable to show which of the two feed horns the signal was being received through, so the exact position of the signal remains unclear. Wherever it was from, this is what the telescope received.
The Wow! Factor
The string of characters in the title, 6EQUJ5, actually is actually the data printout from the observatory’s computer system that represents the Wow! signal. Due to limited space on the printout of the computer that was capturing and analysing the data, the staff opted to represent the data using base-35 numbers. This means that values from 0-9 were represented as numbers and values from 10-35 were represented as the letters A-Z. What do these values actually mean? Each row of data represents roughly 12 seconds of integration time for the computer; 10 seconds to capture the mean intensity for each of the 50 10 kHz wide channels and about 2 seconds to process it. Over this 10 seconds the baseline intensity is calculated over each integration and subtracted off. Then, the remainder from this subtraction is then divided by the standard deviation calculated from the last 60 data points. In this situation, the standard deviation signifies the noise. These two numbers are then divided to give the signal to noise ratio (S/N). This ratio is then truncated to an integer. These are the numbers that are recorded on the printout. We can now consider the signal and translate them back to their values from the base-35 notation we described earlier.
[table id=1 /]
If we plot this data and fit it to a Gaussian, we can see the true form of the data. Note that the error bars are due to the truncation of the recorded values described above.
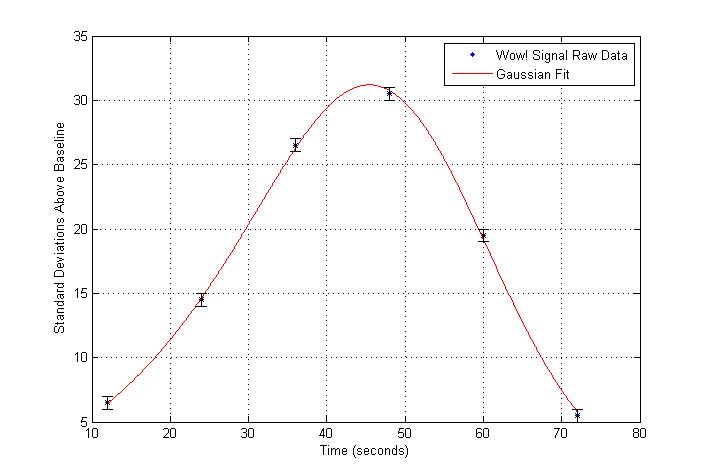
You can see now from this plot what exactly the Wow! signal looked like. A powerful signal that peaked at somewhere around 32 times the signal to noise ratio of the observations. This was the most intense signal ever received by the telescope. What caused it?
What Could It Be?
This is still a hotly contested point to this day. What actually caused this intense spike in radio emission in that particular band? To try and ascertain this we should first try and figure out what it was not. The interesting thing about this whole problem is that the channel in which this narrow band emission appeared is protected for the purposes of radio astronomy. The spectrum around 1420Hz is reserved exclusively for use by radio astronomers. This is because it is the frequency at which neutral hydrogen emits at. This means that if these guidelines were being followed, there was nothing around that could possibly have produced those radio emissions. This immediately scraps most possible human sources of radio transmission from the equation. Another possible explanation was that the radio emission was caused by a planet or some other natural astronomical phenomena. The problem with this is that these objects are very unlikely to produce narrow band emissions of such a concentrated intensity for such a short time.
Some more feasible explanations are that what they telescope picked up was a harmonic of a lower frequency transmission from some ground based source that was reflected off the atmosphere. When radio emissions are transmitted at a fundamental frequency, the same signal gets transmitted, albeit at a much lower intensity, on integer multiples of that frequency. So for example, some possible frequencies that would produce a signal at the telescopes observing frequency are 710MHz (first harmonic) and 473.33 MHz (second harmonic). However, for this to cause the desired effect, the signal would need to be transmitted into space and reflect off of something like metallic space debris. For this to be possible, our theoretical debris would be required to remain stable in both position and rotation for 72 seconds; which seems highly unlikely given the motion of such material. Given that we can discard these various possible explanations, we now have to consider the other possible explanation.
Is It Life?
More by default than any other more satisfying metric, I am forced to conclude that it is entirely possible that such a narrow band emission could have been sent by some kind of extra terrestrial intelligence. The probability of the signal source being any of the above seems is so low that this now becomes the most likely of possible explanations; primarily due to the fact that this theory cannot be falsified. As a scientist, I’d like a lot more data on this phenomena before I could legitimately draw such a sensational and fantastic conclusion. Given the number of stars whose light has reached us, it’s entirely possible that some extra terrestrial intelligence may be trying to communicate. The problem with the Wow! signal is that it concludes with the fact that the signal from that particular patch of the sky has never been seen before or since, as such the only workable data set we can work from is those 6 data points in the title. Who knows, one day we may see a repeat of this phenomena and this time we’ll be prepared. Until that day SETI will keep scanning our skies for signs of other intelligent life and it will continue to remain a mystery what exactly it was that the Big Ear heard that day in 1977.
